Real-time Log Aggregation Platform for Cookpad storeTV Ad Delivery
2018-10-18Learn how I built a real-time streaming architecture with AWS Kinesis, Lambda, and DynamoDB to solve ad impression tracking challenges for Cookpad storeTV's in-store digital displays. Featuring watermarks for handling delayed logs and efficient ETL processing.
NOTE: This is a mirrored tech blog that I published in Japanese at the company blog while I was working for Cookpat in 2018.
Real-time Log Aggregation Platform Supporting Ad Delivery for Cookpad storeTV
Hello, I'm Ken Wagatsuma from the Media Product Development Department. As a server-side engineer, I'm responsible for the development and operation of ad delivery systems.
In this post, I'll introduce the real-time log aggregation platform for Cookpad storeTV's advertising products.
Ad Development for storeTV
What is storeTV?
storeTV is a service that broadcasts cooking videos in supermarkets by installing proprietary Android devices in stores that play recipe videos suitable for that specific sales area.
For more detailed service overview, please refer to the presentation slides from Cookpad TechConf 2018 by one of our team members.
Overview of storeTV Advertising Products
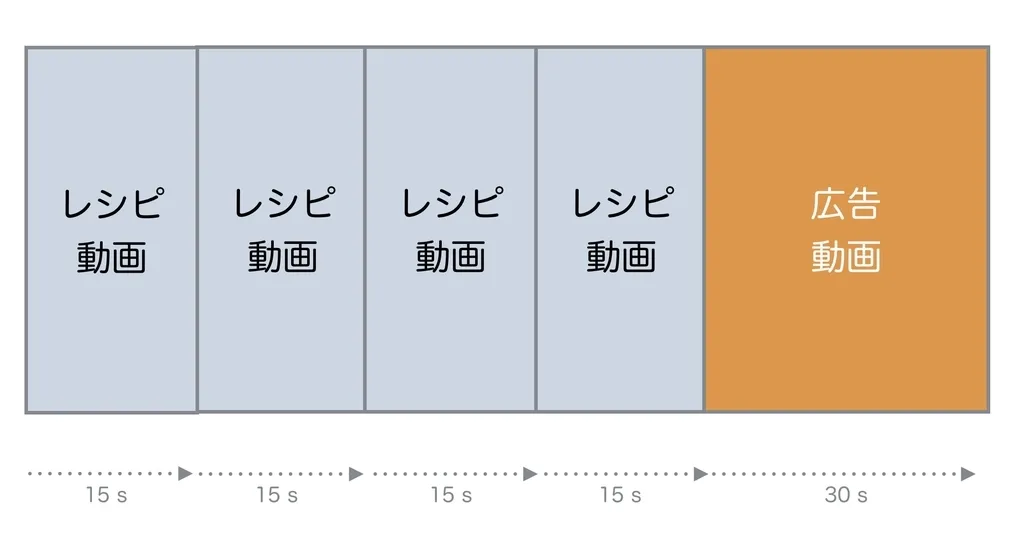
storeTV offers impression-guaranteed ad products. An impression-guaranteed ad product ensures, for example, that "ads will be displayed N times per week." With storeTV, we plan to play ad videos after displaying recipe videos multiple times.
Basically, we roughly predict inventory (total number of possible ad video plays) from actual playback operations, calculate ratios based on that inventory, and distribute delivery plans including delivery ratios to devices installed nationwide.
Let me explain the specific calculation logic.
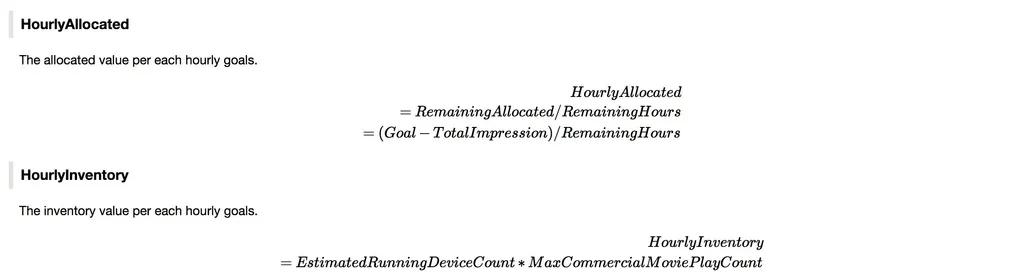
The delivery ratio is calculated on an hourly basis. The "delivery ratio" for a specific hour is defined as "hourly allocation / hourly inventory."
Ratio = HourlyAllocated / HourlyInventory
| Variable | Description |
|---|---|
Ratio |
"Delivery ratio" |
HourlyAllocated |
"Hourly allocation" |
HourlyInventory |
"Hourly inventory" |
Here, "hourly allocation" refers to the number of times we want to play ads per hour. Since the target impressions vary by ad product, we can calculate this by dividing the difference between "target impressions" and "actual impressions" by the "remaining time units."
"Hourly inventory" is defined as the maximum number of ad plays possible in one hour. For storeTV's impression-guaranteed ad products, as mentioned earlier, with the characteristic of "being delivered once every 90 seconds," we can set the "maximum ad video plays per hour" at 40.
Therefore, "hourly inventory" can be calculated as "number of currently operating devices * maximum ad video plays per hour."
| Variable | Description |
|---|---|
Goal |
"Target impressions" |
TotalImpression |
"Actual impressions" |
RemainingHours |
"Remaining time units" |
MaxCommercialMoviePlayCount |
"Maximum ad video plays per hour" |
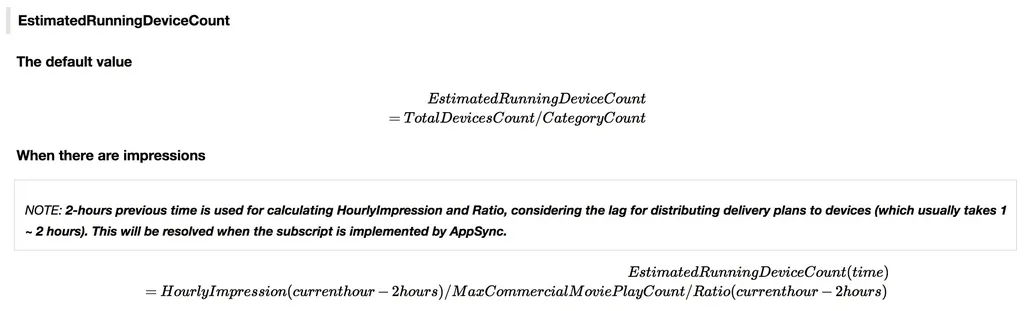
Finally, regarding the "number of currently operating devices," it's almost impossible to get an accurate value in real-time, so we need to estimate the number of active devices from impression logs that have actually occurred.
Specifically, when impression logs have not yet been generated (e.g., right after starting ad delivery when logs haven't reached from any device), we use "total distributed devices / number of categories" as the default value.
Once impression logs start arriving, we calculate an approximate value using "impressions from the last 2 hours / maximum ad video plays per hour / delivery ratio for the last 2 hours."
| Variable | Description |
|---|---|
TotalDeviceCount |
"Total distributed devices" |
CategoryCount |
"Number of categories" |
EstimatedRunningDeviceCount |
"Number of currently operating devices" |
HourlyImpression(currenthour - 2hours) |
"Impressions from the last 2 hours" |
MaxCommercialMoviePlayCount |
"Maximum ad video plays per hour" |
Ratio(currenthour - 2hours) |
"Delivery ratio for the last 2 hours" |
Challenges Unique to storeTV
While these requirements might seem simple at first glance, there are many challenges that differ from the pure advertising delivered on the main Cookpad platform.
For example, there's a significant gap between the number of distributed hardware devices and the number actually in operation. Specifically, ads might not play due to "system-related reasons" (network delays, update issues) or "operational reasons" (battery depletion, failure to follow procedures to play videos). If we don't account for these non-operational devices when calculating delivery ratios, we risk failing to meet the guaranteed playback numbers for our products.
Therefore, we needed to aggregate video playback logs in real-time to understand operational status. By referencing impression logs in real-time, we can calculate delivery ratios that better match actual operational conditions. Following more accurate delivery ratios allows us to minimize the risk of impressions falling short or exceeding targets.
For more information on this topic, please refer to the following resources: Past and Future of Ad Delivery on cookpad storeTV
Real-time Log Aggregation Platform for storeTV Advertising
We needed to prepare a real-time log aggregation platform. In the following sections, I'll discuss the specific architecture, implementation challenges, and solutions we developed. This is based on the slides presented at adtech research meeting: Real-time Log Aggregation Platform for storeTV Advertising.
These materials were presented while the project was being implemented and summarize theories and resources about streaming processing. Therefore, some descriptions (specifically the architecture of the Analysis layer) differ from the final form I'll introduce today.
Architecture
First, let me introduce the overall architecture.
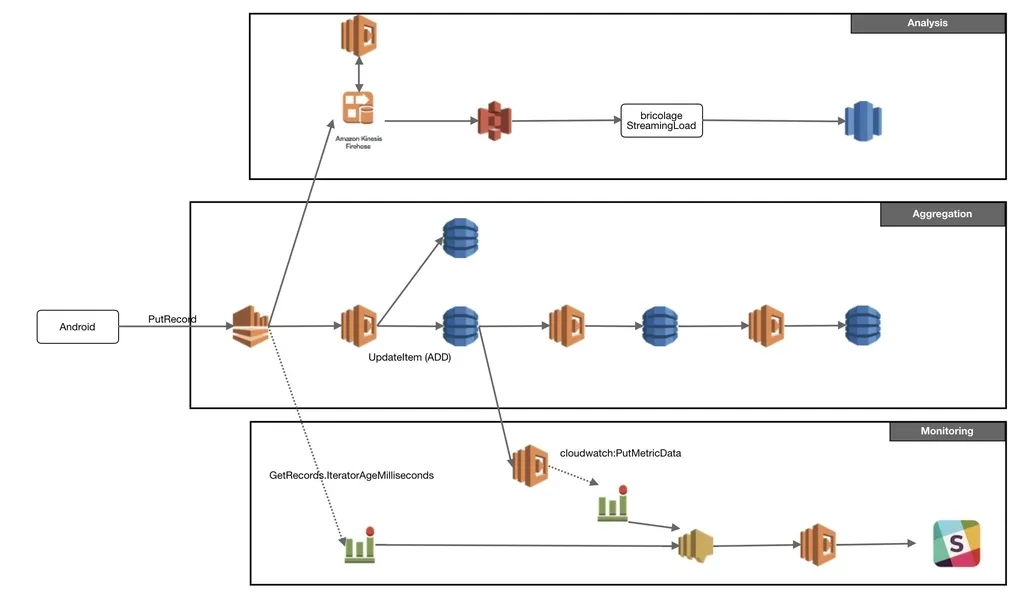
It consists primarily of three layers:
- Aggregation: Layer for aggregating impression logs
- Monitoring: Layer for detecting stream blockages and log delays
- Analysis: Layer for inserting real-time logs into Redshift for analysis
As explained earlier, our highest priority task was aggregating impression logs in real-time to calculate delivery ratios. We created the Aggregation/Monitoring layers accordingly.
Later, since we were already receiving all ad video playback logs through Kinesis Streams, we created an Analysis layer for near real-time analysis (approximately 10-15 minutes). At our company, by leveraging the data utilization platform provided by the DWH team, we can establish high-quality analysis flows company-wide at low cost. In this case too, once we send data to S3 Bucket via Kinesis Firehose, the data flows into Redshift through the DWH mechanism.
Aggregation
Core Design
In the Aggregation layer, Android devices send JSON logs like the following:
{
  "delivery_id": 123,
  "delivery_plan_commercial_movie_hourly_goal_id": 100,
  "identifier": "foobar1234",
  "sending_time": "2018-07-12T10:22:58+09:00"
}
We aggregate these logs by minute according to the timestamp sent by the device and store them in DynamoDB:
| name | type | schema | example |
|---|---|---|---|
| delivery_id | String |
Hash Key | 123 |
| period_id | Int |
Sort Key | 201807121022 |
| impressions | Int |
- | 1 |
Here, we use DynamoDB's Update Expressions ADD operation to increment the impressions item. This way, impressions gradually increase as JSON logs flow in.
Next, we enable DynamoDB Streams for these aggregated records and extract them with another Lambda. This Lambda aggregates the records stored in minute units into hourly units and stores them in another DynamoDB table. From that DynamoDB Streams, we further store them by day.
By gradually aggregating this way, we count stream data at appropriate granularities. The client calculating delivery ratios references impression records from the necessary tables as needed.
Late Logs & Watermarks
Some might have noticed that the first Lambda is writing to two DynamoDB tables.
Here, logs delayed beyond a certain time are not included in subsequent aggregation logic but are written to a separate delay-specific table.
In streaming processing, "how to handle delayed logs" is a long-standing challenge. Logs can be delayed for various reasons: clients being offline, message brokers failing, bugs in the consumer side processing data from message brokers, or consumers unable to process data within a certain time due to unexpectedly high volumes and insufficient time to scale out.
For theories and general practices in streaming processing, I recommend Chapter 11 of "Designing Data-Intensive Applications" and O'Reilly's two-part essay series (1, 2).
For handling delayed logs, we specifically decided to process them using Watermarks. Watermarks embed information about "how far logs have been processed" as a "mark" in stream data, allowing each consumer to determine if data is delayed when processing.
In particular, we referenced Apache Spark's Watermark implementation to design a system that can calculate on memory. We considered an implementation where "the last processed timestamp" would be saved for each consumer in an external data source, but avoided it due to the cost of preparing separate tables and the cost of queries each time.
Specifically, the pseudocode is included on slide p31 of the presentation mentioned at the beginning. We determine delay by checking "whether the timestamp of a log in a series processed by the consumer deviates from the median by more than plus or minus 5 minutes."
While Apache Spark's example uses maximum values, with storeTV, due to the characteristic that client-side system time can be manipulated, completely future times might be erroneously sent. Using the maximum value method would cause outliers to pull the value, discarding large amounts of correct logs that should be included in the aggregation logic. Therefore, we use the median.
Monitoring
Streaming Delay
Next is monitoring. As explained earlier, streaming processing can get blocked for various reasons:
- Clients are offline
- Message brokers have failed
- Bugs in the consumer side processing data from message brokers
- No bugs but consumers unable to process data within a certain time due to unexpectedly high volumes and insufficient time to scale out
Therefore, we monitor using two methods:
- Kinesis Streams'
GetRecords.IteratorAgeMilliseconds - Whether the timestamp of impression logs actually written to DynamoDB is within a certain threshold
First, Kinesis Streams' IteratorAgeMilliseconds indicates the time of the last processed record. The more the IteratorAge deviates from the current time, the larger this value becomes. By monitoring this value, we detect incidents where records are not processed due to bugs or failures on the Lambda side.
Additionally, there's a Lambda to detect whether impression logs actually written to DynamoDB are within a certain threshold from the current time. This detects cases where, for example, due to Kinesis failures, streams don't flow for a certain period, and then a series of accumulated streams flow after recovery.
We specify SNS Topics as the notification destination for CloudWatch Alarms. We designate these Topics as the event source for a Lambda responsible for notifying Slack. This way, we established a monitoring flow while keeping notification logic responsibilities undistributed.
CloudWatch Dashboard
We also need to separately monitor the uptime of various components like Kinesis Streams, Lambda, and DynamoDB. Since everything is composed of AWS services, we used CloudWatch Dashboard as our monitoring tool. I recommend it because it allows for easy creation of necessary metrics from existing ones.
Analysis
Finally, the Analysis layer. We simply specify Kinesis Firehose as the consumer of Kinesis Streams and output to S3. After outputting to S3 in the specified format, data is written to Redshift through the DWH mechanism.
The key point is designating Lambda as a Transformer for Kinesis Firehose. With Firehose, instead of flowing logs directly from Streams to S3, we can add preprocessing with Lambda. This means we can simply implement the Transform mechanism in general ETL processing.
Firehose has a buffering mechanism, allowing settings like "output to S3 after 5 minutes or when total log volume exceeds 1 MB." Since "No Configuration" is one of Firehose's selling points, when you want to change buffering frequency, you can do so with a single setting change from the AWS Console without modifying code.
Programming Language
For implementing the series of Lambdas, we used Golang. As a deployment tool, we used the Serverless Framework. The background of these technology selections is described in the latter half of the slides mentioned at the beginning, so please refer to those if you're interested.
Conclusion
While I normally develop ad delivery servers for the main Cookpad platform, the video advertising domain also has many technically challenging issues and is a very interesting field.